Write
What to do with layout, tables and figures?
Text layout
Make sure your text is serene and simple. Sometimes your faculty provides a specific template in terms of font and font size but that’s not always the case. If you don’t have a template to work with, make sure to choose a simple font such as Times New Roman or Arial. If you only submit your work online and you don’t need to print it, it’s better to choose Arial because that is a sans serif font (no horizontal lines on the characters). In any case, make sure that your layout is consistent, both in terms of font and font size, as well as alignment.
Tables and figures
Always bear in mind what the purpose of a table or a figure is. In most cases, you try to visualise numerical data or a complex concept in a structured and clear way. In that case, make sure that your table or figure is easy to interpret and doesn’t lead to extra confusion. Are you trying to summarize results you found in literature? Leave out as much data as possible. Are you presenting your own findings? Mention the misses, the outliers and the duplicates.
A matching caption
Every table or figure is accompanied by a caption. According to the style rules, a caption should be positioned above a table and below a figure. Make sure the caption stands on its own and can be understood separately from your text, table or figure.

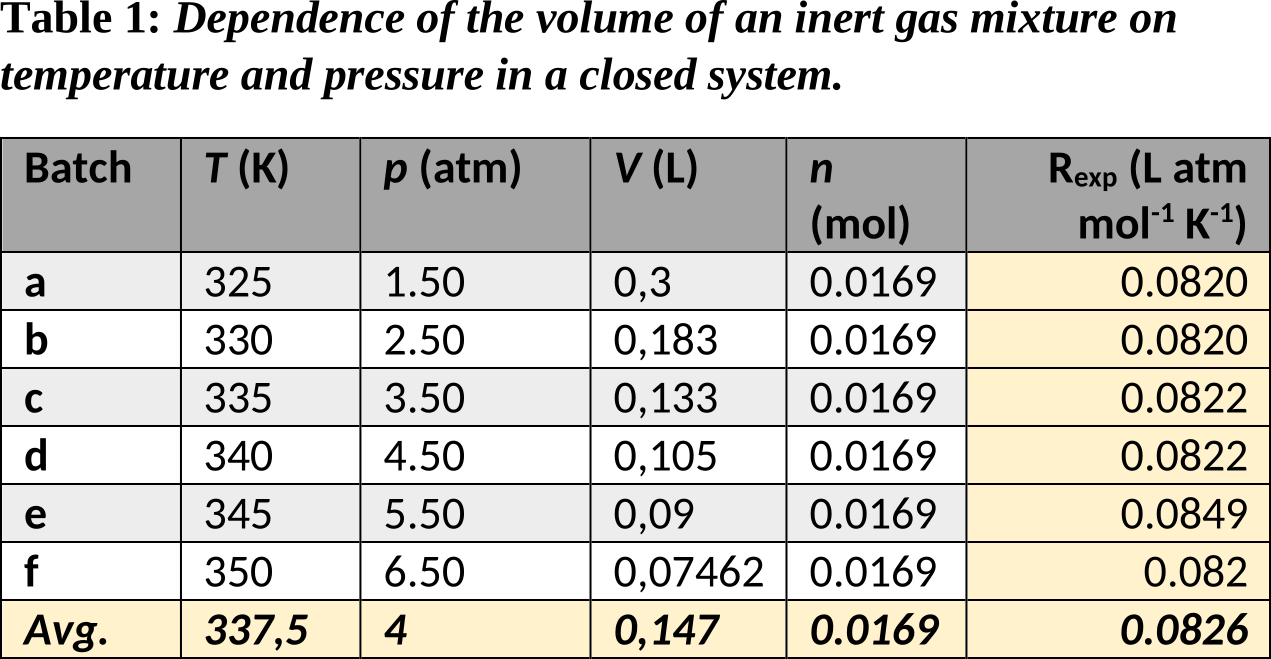
Table 1. Results (aa)-(bi) at 5.3 bar.

Table 1. The effect of temperature changes on the volume of an ideal gas at a constant pressure of 5.3 bar.
An elegant look
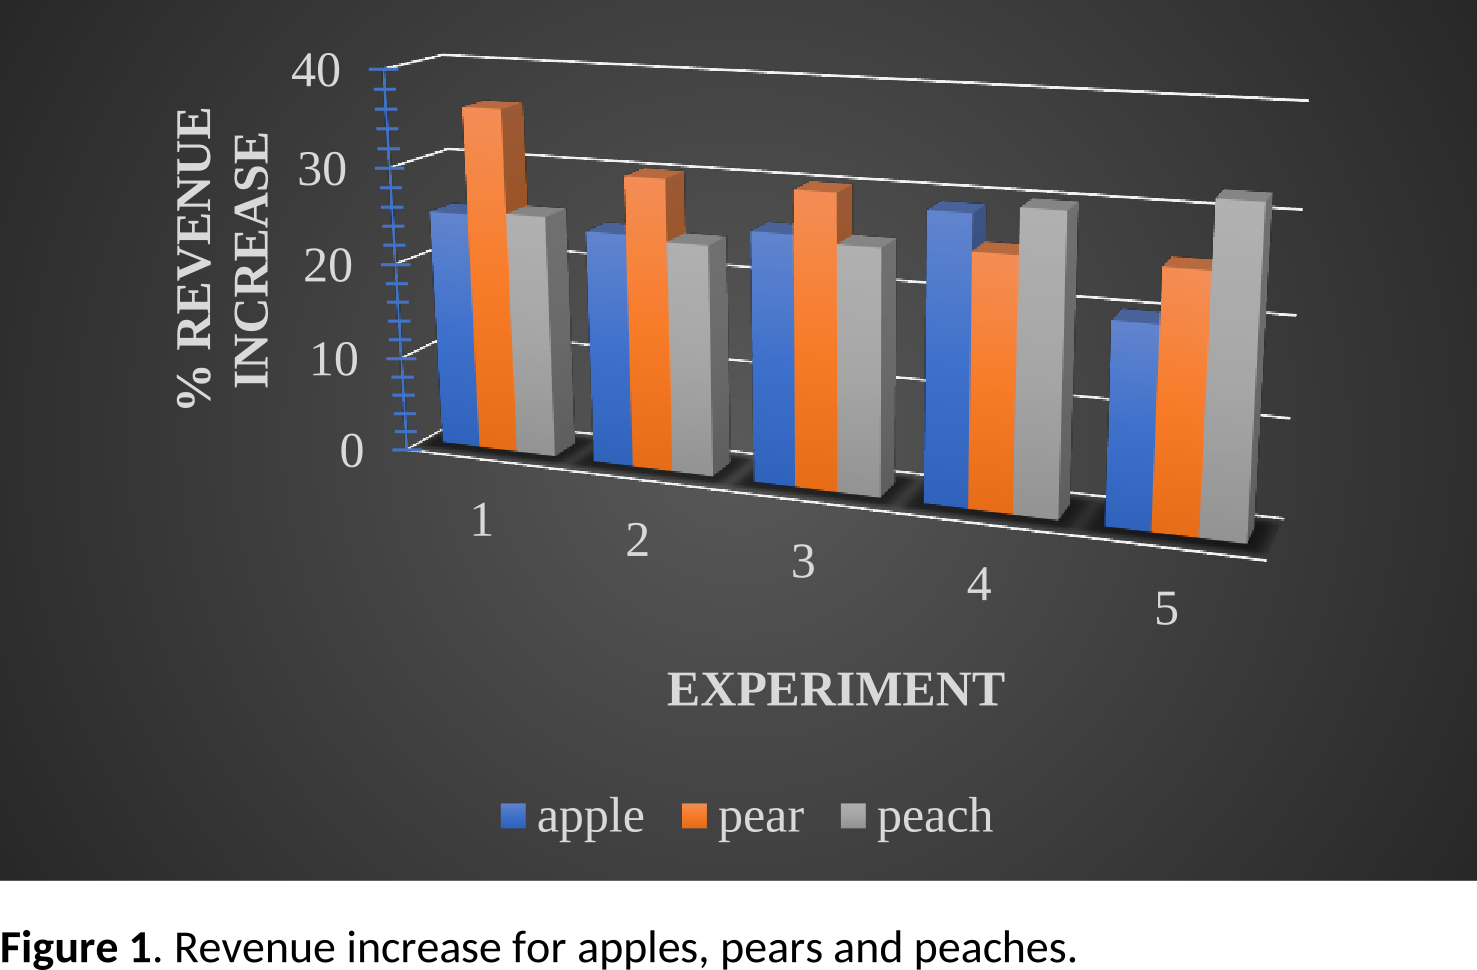
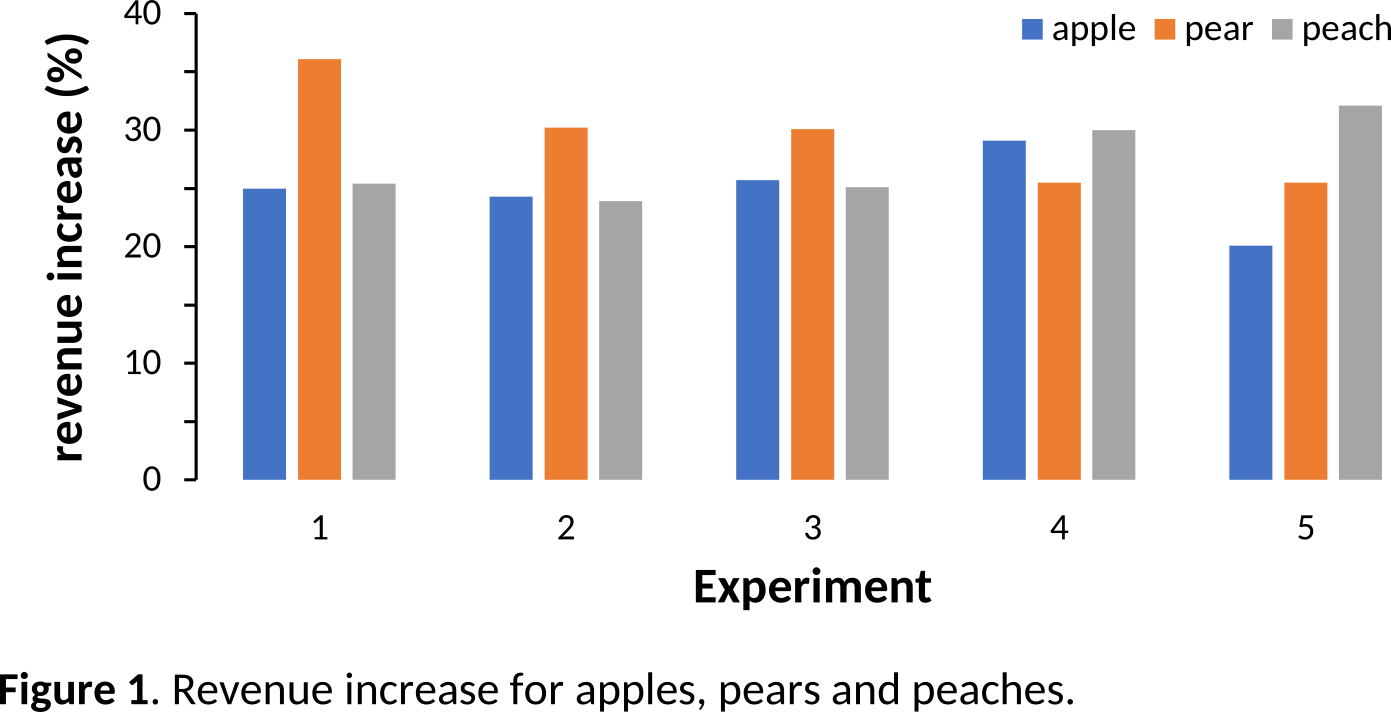
Avoid having too many different colors, fonts, lines and special effects. Everything you add should have a specific meaning or should at least make it easier to interpret your table or figure. In the case of tables, too many vertical or horizontal lines and coloured rows are often distracting and redundant.
Be consistent
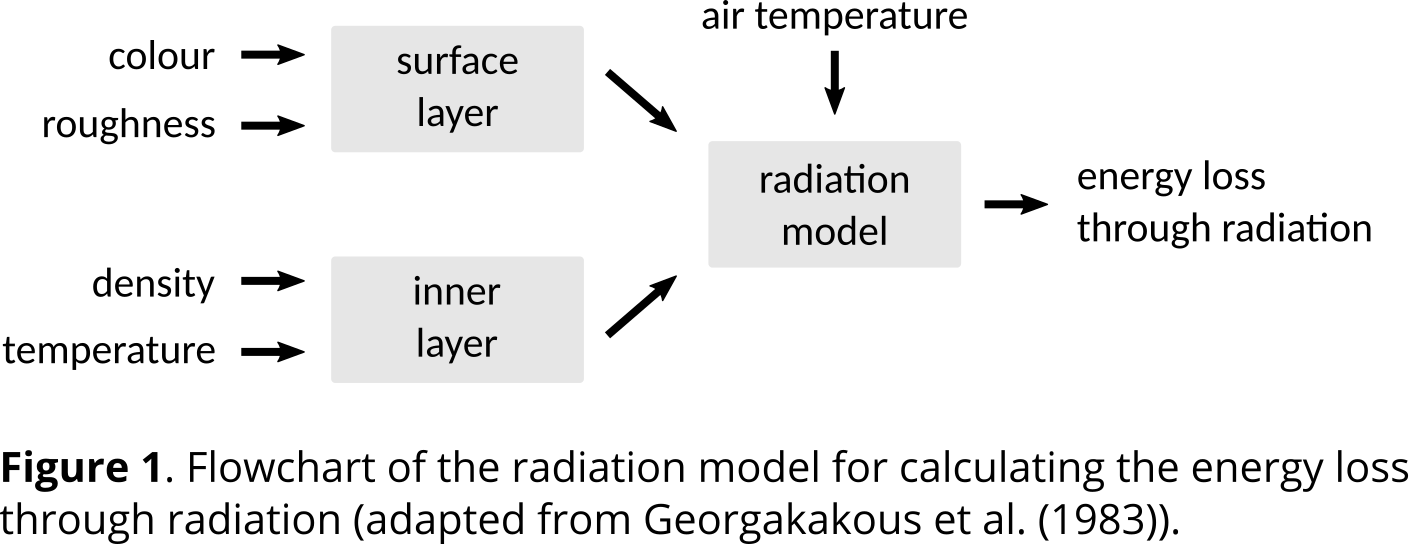
Use a uniform size and colour code in block diagrams, for example. If you are using colours to visualise data, look for a colour scale that you can use throughout your work. A uniform size especially applies to chemical structures and mathematical formulas. In addition, make sure to use the same notations for variables in your text and in your mathematical formulas.
Also make sure that data points can be read unambiguously. It should be clear which quantity and which unit is being reported. Therefore, it is important to label all axes of a graph.
Mention the source
If you use a table or figure from the literature, don’t forget to mention the source. Sometimes the resolution of a table or figure is too bad to include it in your work. In this case, you should make a revised version for your paper.
Limit redundancy
If you use the same unit or power of ten in a column or a table over and over again, you should include it in the caption or in the first row of the table. This also applies to columns with constant parameters or measurement values. Use abbreviations to avoid repeating long terms.
Refer to the table or figure
Don’t just include tables or figures in your paper without mentioning them in your text. Include your table or figure in your text. When doing so, don’t leave your reader in the dark but give an interpretation of possible results.

Table 1 shows the effect of temperature changes on the volume of an intern gas at a constant pressure in a closed system. Table 2 shows the effect of the occurrence of combination reactions on the volume of an ideal gas at a constant pressure and temperature in a closed system. Table 3 shows the effect of pressure changes on the volume of an inert gas at a constant temperature in a closed system.

The experiments from tables 1 to 3 clearly illustrate the ideal gas law (pV = nRT). Tables 1 and 2 indicate that the volume of a gas mixture (V) is directly proportional to the temperature of the gas mixture (T) and the number of gas molecules (n) respectively. Furthermore, table 3 shows that the volume of a gas mixture is inversely proportional to the pressure of the gas mixture (p). All experiments were carried out in a closed environment, in which the number of gas molecules could be varied via the introduction of combination reactions.

